Michigan Education System Ruined by Diversity Politics
by Lewis Loflin
Follow @Lewis90068157
Related: Diversity Destroyed Aurora Colorado Schools.
(Below) Another reason Michigan Schools are failing. See Michigan Proves Merit Based Immigration Needed for Muslims.
Update November 2022. Since I have been tracking education in Michigan and elsewhere since 2010, the situation has worsened.
Update December 2022: The Supreme Court is now hearing once again the issue of affirmative action racism, and the use of race, in college admissions. Overturning this racial caste system must be a priority.
Like Michigan, the Progressive racists will find ways around the equal treatment of students desiring to racialize everything.
Diversity and mass immigration cripple our education system in several ways. Illiterate peasants from backward nations bring their culture with them. Even when their parents have the best intentions, and nearly all do, the education industry worsens the outcome.
The Progressive education industry refuses to encourage integration and assimilation into American culture. Progressives prefer to promote a collection of ethnic and racial under-classes they can better control.
The students come in being English deficient; schools cheat them of primary education, attempting to engineer "equal" outcomes.
Draining resources dealing with low-achieving immigrants and illegal aliens leave few resources for low-achieving blacks and other poor students.
In the name of equality, it is insane to graduate students with all reading at a 6th-grade level. Then they scream racism because these masses of low achievers they created fail to achieve.
Even worse, they cheat students that can achieve by lowering education standards. They allow disruption and violence into schools, fear removing, and I'll be blunt here, mainly black, non-white thugs and criminals. Numbers don't lie.
Update April 22, 2014: The Supreme Court has overturned a lower court ruling against the voter-approved ban on affirmative action racism in Michigan. While it's hoped we can finally end institutionalized anti-white racism; it's not over yet. Even before this ruling, the liberal racists were already at work.
Michigan public schools and colleges are chaos and failure by promoting diversity. By pandering to low-achievers by lowering standards and punishing success, Michigan Public schools are failing even white and Asian students.
Liberals are obsessed with the issue of race and equal outcomes - they refuse to treat students as individuals but instead as racial groups. Education has taken a back seat to these policies that fail students of all races. They demand more funding to fix the very problems they create.
Here we will take a hard look at Michigan which is at the center of institutionalized diversity racism and the havoc this has created in public education.
In the courts again
To quote the New York Times April 1, 2012 article titled, "To Enroll More Minority Students, Colleges Work Around the Courts" we find:
...no matter how the court acts, recent history shows that when courts or new laws restrict affirmative action, colleges try to find other ways to increase minority admissions...if the Supreme Court limits the options, college and universities will "be seeking diversity by any legal means possible," said Ada Meloy, general counsel of the American Council on Education.
But a decision overturning affirmative action could produce a national pattern of more liberal states going further to mimic the current system than more conservative states. Defenders of affirmative action are most likely to see any new system as unfair to black and Hispanic students, while critics will still see it as unfair to whites and Asian-Americans...
This has come about from the 2003 Supreme Court ruling against the University of Michigan's diversity racism program penalizing Asian/white achievement to reward black/Hispanic inability to compete in a fair and open society. In February 2012, the Court decided to hear Fisher vs. the University of Texas and rule on their diversity racism policies. To quote,
"The Texas system admits the top students at every high school in the state, but also admits additional students with a system that takes race into account."
The NYT notes of those states that outlaw racism and go to merit minority enrollment drops. Well, it should if they need to be qualified.
The newest racial fad is called "the holistic approach," where they make up nonsense to enroll undeserving and unable to do the work required. I'd bet the Supreme Court will give another muddled ruling. Speaking of Michigan, let's find out what they have done lately in the cause of diversity. Note that the scores are mostly dropping year after year.
The State Summary Report for the Michigan Dept. of Education for 2011 is an education horror show. Not only have they failed to educate low-achieving blacks and Hispanics, but they have dumbed down the whole system to the point that even whites and Asians are failing. Note the following are for grade 12 in 2011. Here I've combined "proficient" and "advanced" into "passed" and "partially proficient" and "not proficient" into "failed."
| Year | Passed | Failed |
| 2011 | 37% | 63% |
| 2010 | 41% | 59% |
| 2009 | 39% | 61% |
| 2008 | 46% | 54% |
Note the point spread was 950-1250 and the mean was around 1087 and 1088 is "not proficient". Those scoring advanced (1158-1250) were 1% or less for all four years.
| Year | Passed | Failed |
| 2011 | 17% | 83% |
| 2010 | 19% | 81% |
| 2009 | 19% | 81% |
| 2008 | 20% | 80% |
Note the point spread was 950-1250 and the mean was around 1065 and 1088 is "not proficient". Those scoring advanced (1158-1250) were 1% or less for all four years.
| Year | Passed | Failed |
| 2011 | 22% | 78% |
| 2010 | 21% | 79% |
| 2009 | 24% | 76% |
| 2008 | 26% | 74% |
Note the point spread was 950-1250 and the mean was around 1076 and 1088 is "not proficient". Those scoring advanced (1158-1250) were 3% or less for all four years.
| Year | Passed | Failed |
| 2011 | 28% | 72% |
| 2010 | 29% | 71% |
| 2009 | 28% | 72% |
| 2008 | 38% | 62% |
Note the point spread was 950-1250 and the mean was around 1075 and 1088 is "not proficient". Those scoring advanced (1158-1250) were 2-4% for all four years. Note the 10 point drop from 2008-2011.
| Year | Passed | Failed |
| 2011 | 54% | 46% |
| 2010 | 60% | 40% |
| 2009 | 65% | 35% |
| 2008 | 69% | 31% |
Note the point spread was 950-1250, and the mean was around 1112. Those scoring advanced (1158-1250) were 17-23% for all four years. What is bothersome is the steady drop from 2008-2011. How could their writing and reading skills be so poor yet score highest here?
That is the potential graduating class of 2012. When I examined the State Demographic Report, Spring 2012 was even more shocking. The New York Times article "Racial gaps in Michigan exam results a concern" on June 29, 2012, illustrates the total obsession with race by the Left, be it the press or liberal-controlled school systems. First, let's review grade 11 2012 by race.
A total of 106,321 students took the exams, and when we strip out silly categories such as disabled, that left 96,276. I'll use the same standards as above, noting the points spread is being manipulated and different for every group.
Gender: about 46,733 males and about 49,543 females. Of the males, 50% passed reading, 56% passed writing, 35% passed mathematics, 32% passed science, and 48% social studies. That averages across all subjects 44.2 or over half the students failed.
For females, 53% passed reading, 56% passed writing, 29% passed mathematics, 24% passed science, and 38% passed social studies. The average across all subjects is 40. The schools consider this a success because both failed at nearly equal rates, thus achieving the much-desired gender achievement leveling. I'm sure they will work harder to bring males down closer to females.
The number of Asians (2897) and Hispanics of all races (4289) is minimal overall. Asians nationally are far wealthier per capita than whites, and their cross-subject average is 59.8. Far better than all other groups, but still bad in that over 40% failed as for Hispanics, an appalling 28.2. Most disturbing is only 17% passed mathematics and 14% for science.
Now, if this was racism, just how did Asians so outscore Hispanics?
Now we come to the biggie, blacks. Their cross-subject average is an unbelievable 15.6. That means of the about 14,500 blacks taking the tests, less than 2300 passed and 12,200 failed. And these were the ones that had yet to drop out by the 12th grade, which is often over half. In the Detroit Public School system, only 6% passed the math exam, while 3% passed the science exam.
The school system is 100% black and liberal controlled. Either there's a backroom plot by liberals and black leaders to promote this mass failure to beat the drum of white racism or the problem is culture or IQ.
Across the state, 7% of blacks passed math, and 5% passed science. Remember, leftists and liberals, operate these schools. As often self-hating whites, perhaps they should hate themselves because if anyone is to blame, they are to blame.
Now we come to whites, and there should be a far more significant concern here. About 72,500 whites took these tests. Their cross-subject average is 49. Thus 51% or 35,975 white students failed. That's three times the number of blacks. They scored poorly in math at 36% and 33% in science. In the other subjects, scored close to Asians.
Update: the low white test scores were Muslims. Many are counted as white and score as poorly as blacks.
What I did may not be scientific, but it should illustrate severe problems in the public school systems. Failing one of the five subject areas in my book failed the entire grade.
Now we know why the educational Left must resort to racist' tactics to get any minorities into college at all in Michigan. They fail a far greater number of whites than minority students to pander to low-achieving non-Asians. Whites are the main victims of their lousy school system, not minorities. The system fails because education has taken a back seat to racial social engineering and leveling.
It's time for absolute racial equality and equal treatment, one standard for all, and to instill merit and not race in public education. It's time to end failed diversity racism in our schools.
Ref. Racial gaps in Michigan exam results a concern New York Times June 29, 2012.
Michigan State Demographic Report
Michigan Dept. of Education Summery 2011
Michigan Proves Merit Based Immigration Needed for Muslims
by Lewis Loflin
Detroit Free Press notes in 2018:
Every demographic of students has seen a slide in third-grade literacy. White students, for instance, saw a 6.5 percentage point drop, from 58.2% proficient in 2014 to 51.7% in 2016. That compares with black students, who declined 3.3 percentage points, from 23.2% to 19.9%; Hispanic students, who declined 5.2 percentage points, from 37.2% to 32%, and Asian students, who declined 6.3 percentage points, from 69.7% to 63.4%. Meanwhile, low-income students (those eligible for free or reduced price lunch), declined 6.2 percentage points, from 35.3% to 29.1%; while higher-income students declined 6.4 percentage points, from 66.8% to 60.4%.
And:
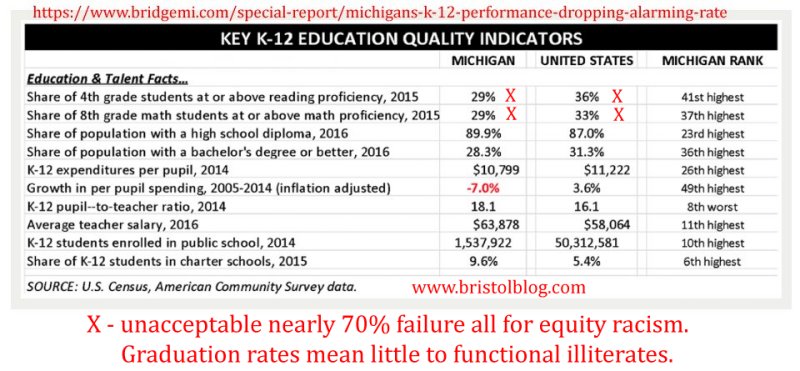
Just 23% of Michigan's students graduate prepared for college or careers. And the state ranked 46th in fourth-grade reading and 37th in eighth-grade math on a rigorous national exam.
Also see Middle East Chaos About Religion, Over Population.
Muslim immigration like all immigration should be merit based along the line of international PISA scores.
Possible Muslim fundamentalist' religious violence and must also be scrutinized.
What is PISA?
SOURCE: Organization for Economic Cooperation and Development (OECD), Program for International Student Assessment (PISA), 2018.
PISA test scores are allotted in roughly the same fashion as for the SAT.
This should involve a test in English and severe restrictions on sponsoring relatives. Many of their relatives end up on welfare.
See Immigrants Dump Relatives On Welfare.
Another lie promoted by liberals is the violence and dysfunction in many Muslim nations is due to climate change or imperialism. That is nonsense.
The problem is massive over-population and Muslim religious violence. See Excuses for Muslim Religious Violence.
Muslim nations even wealthy ones have low academic achievement rates. Allowing those from North Africa and the Middle East to identify as white hides the problem. When I looked into low academic achievement rates in Michigan I was stunned by how low the rate was for whites. I blamed it on teachers. The problem was Muslim immigration.
This is illustrated by failing Muslim schools in Dearborn Michigan. Dearborn identifies as 89% white but is little better than the failing third-world school system of nearby Detroit.
The Detroit metropolitan area is home to the largest concentration of Arab Americans (403,445).
Source: Public education crisis felt in Dearborn schools 01/05/2017 www.arabamericannews.com
Dearborn is no stranger to such issues in public education. Like neighboring Detroit, a city plagued by the failure of its public school system, Dearborn faces risks as a school district a sliver away from priority status, referring to the lowest achieving 5 percent of all public schools in the state.
But their schools do adhere to Islamic culture and that is the problem. The press proudly proclaims of failing school systems: "Dearborn Schools leading the way in accommodating immigrants"
Ref. www.detroitjournalism.org 9/19/2016.
PISA illustrates once again just how poorly even rich Islamic nations/cultures are on education. Even Muslim nations in Europe do very poorly.
Shocking is how poorly Israel scores, but no surprise to me. Most of their population is Middle Eastern or North African in origin regardless of religion.
U.S. whites score 33 points above the OECD average, the highest scoring Muslim nation (Turkey) 25 points below. Wealthy Saudi Arabia 102 points below.
| Education system | Mean | Reading | Math | Science |
| U.S. Asians | 549 | 556 | 539 | 551 |
| U.S. Whites | 521 | 531 | 503 | 529 |
| United States | 495 | 505 | 478 | 502 |
| U.S. two or more races | 492 | 501 | 474 | 502 |
| OECD average | 488 | 487 | 489 | 489 |
| U.S. Hispanics | 470 | 481 | 452 | 478 |
| Israel | 465 | 470 | 463 | 462 |
| Turkey¹ | 463 | 466 | 454 | 468 |
| U.S. blacks | 436 | 448 | 419 | 440 |
| United Arab Emirates | 434 | 432 | 435 | 434 |
| Malaysia¹ | 431 | 415 | 440 | 438 |
| Brunei Darussalam | 423 | 408 | 430 | 431 |
| Albania | 420 | 405 | 437 | 417 |
| Jordan¹ | 416 | 419 | 400 | 429 |
| Qatar | 413 | 407 | 414 | 419 |
| Bosnia and Herzegovina | 402 | 403 | 406 | 398 |
| Kazakhstan | 402 | 387 | 423 | 397 |
| Baku (Azerbaijan)² | 402 | 389 | 420 | 398 |
| Saudi Arabia | 386 | 399 | 373 | 386 |
| Indonesia | 382 | 371 | 379 | 396 |
| Lebanon | 377 | 353 | 393 | 384 |
| Morocco¹ | 368 | 359 | 368 | 377 |
| Kosovo | 361 | 353 | 366 | 365 |

- Michigan Education Ruined by Diversity
- Education Ruin in Michigan For Diversity
- Federal Court Overturns Michigan Anti-Racism Law
- Origins of Socialist Racism
- Critical Race Theory is Irrational
- Western-American Culture is Superior - Get Over It
- Scientific Advances Built on Western Culture
- Remapping Class Warfare to Racial Warfare
- Intelligence Predicts Economic Social Outcome
- Baltimore Schools Another Diversity Failure
- Crime Rates Proportional to Diversity
- Black Boys Can't Read in California
- School Violence Hidden in Virginia Schools
- African Americans Worth $8 in Liberal Boston
- Liberal California Poverty Capital of America
- Working Class Whites Banned by Harvard Elite
- Jews Over Represented at Elite Colleges?
- Working Poor in Southwest Virginia Bristol
- Violence Rocks Philadelphia and Norfolk Virginia
- National Elite Use Race to Cover Greed, Class Conflict
- Disproportionate Black Crime
- Progressivism is a Cult
Web site Copyright Lewis Loflin, All rights reserved.
If using this material on another site, please provide a link back to my site.